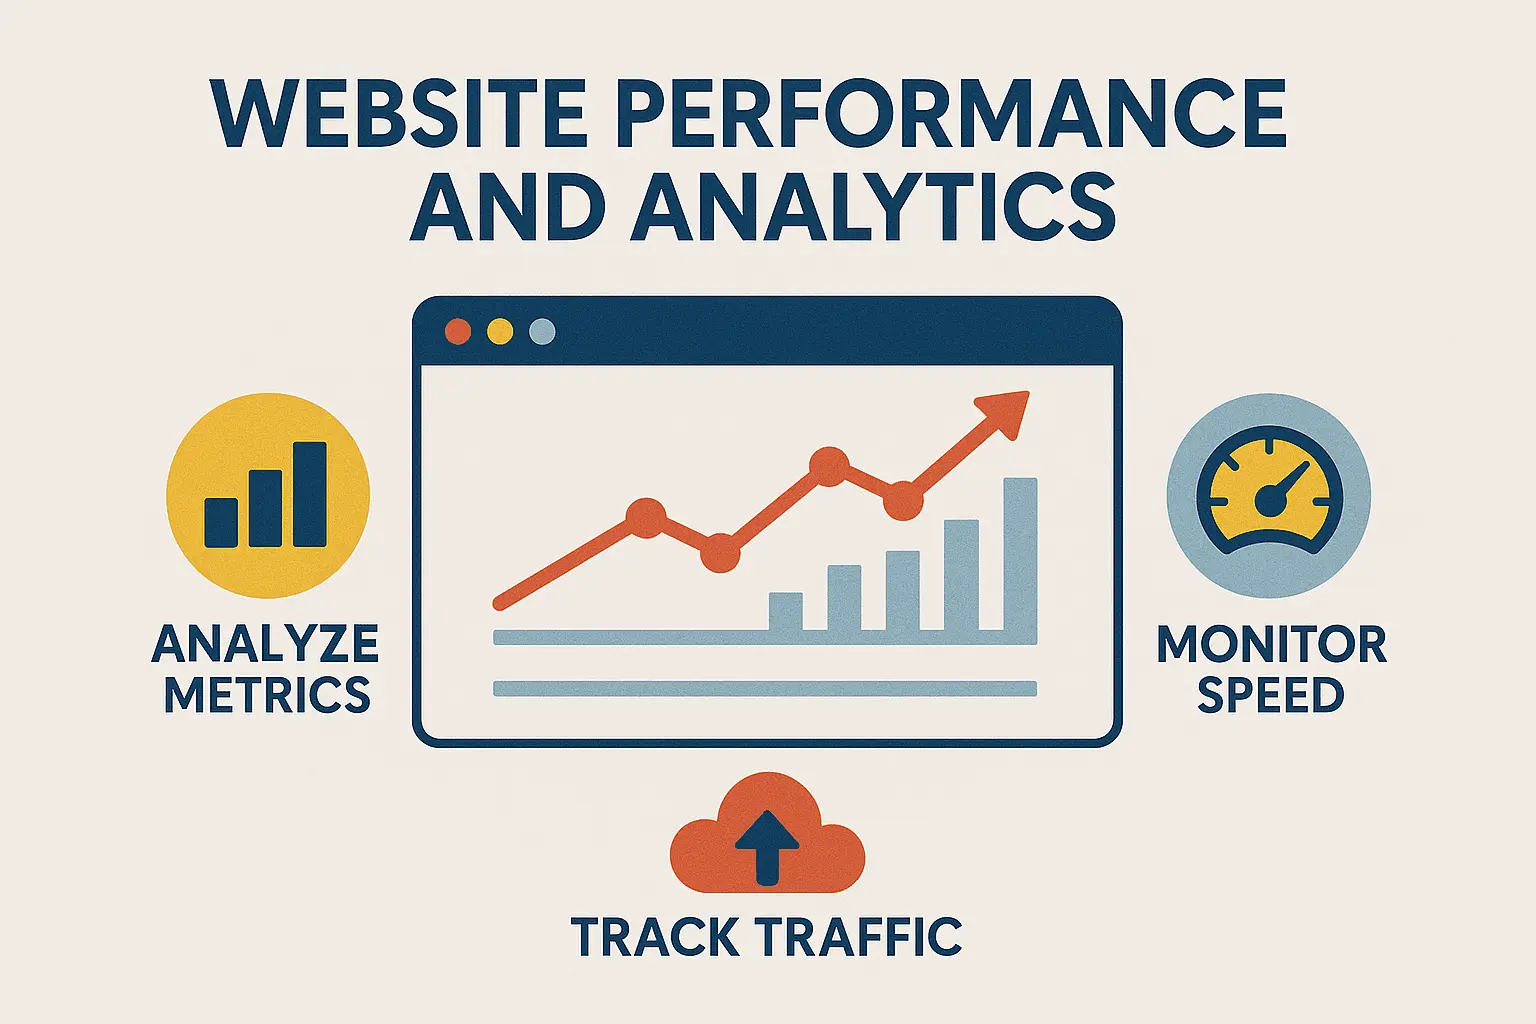
How Website Data and Speed Create Measurable Business Results
Learn how leveraging analytics and optimizing website performance go hand in hand — and why every millisecond and data point can lead to more conversions, happier users, and higher profits.
Introduction
Your website isn’t just a digital brochure — it’s a growth engine. But to make it work efficiently, you need two critical components: analytics and performance. Analytics reveals what users are doing, while performance ensures their experience is fast, smooth, and satisfying. When combined, they form a powerful strategy for driving results.
1. Why Analytics Matters
- Understand behavior — Track what users do, where they go, and what makes them leave.
- Optimize channels — Discover which traffic sources drive the most valuable visitors.
- Improve funnels — Identify where leads drop off and refine the user journey.
- Make informed decisions — Use data to back every update, design choice, or campaign.
- Measure ROI — Connect performance to business outcomes like sales or sign-ups.
2. The Business Impact of Website Performance
- Faster = better — Users expect lightning-fast load times; delays cost conversions.
- SEO benefits — Google rewards fast, mobile-friendly websites in search rankings.
- Boost engagement — Smooth, responsive sites keep users exploring longer.
- Reduce bounce rates — Performance directly affects first impressions.
- Stay scalable — A performant site handles traffic spikes without breaking.
3. How Analytics and Performance Work Together
- Spot performance-related drop-offs — High exit rates? Analytics can show if speed is to blame.
- Segment issues — Find which devices, browsers, or regions struggle most.
- Test performance changes — Measure how speed boosts impact user behavior.
- Correlate with goals — Did faster loading lead to more sign-ups or sales?
- Create feedback loops — Let real-time data drive ongoing optimization.
4. Key Metrics to Monitor
Analytics
- Users & sessions
- Bounce rate
- Session duration
- Goal completions
- Conversion rate
- Funnel drop-off points
- Traffic source breakdown
- Behavior flow
Performance
- Page load time
- Time to First Byte (TTFB)
- First Contentful Paint (FCP)
- Largest Contentful Paint (LCP)
- Cumulative Layout Shift (CLS)
- Time to Interactive (TTI)
- Number of requests & file sizes
5. Best Practices for Optimization
- Audit regularly — Run performance and analytics reports consistently.
- Focus on high-traffic pages — Prioritize speed and data tracking where it matters most.
- Optimize assets — Compress images, minify code, use lazy loading.
- Streamline scripts — Eliminate unnecessary plugins and reduce third-party bloat.
- Use caching & CDNs — Improve global load times with content delivery networks.
- Create dashboards — Monitor KPIs in real time and act quickly on insights.
Conclusion
Analytics tells you what’s happening. Performance shapes how it feels. Together, they help you craft a website that not only performs — but converts, delights, and grows with your business.
Oceanside Web Design can help you turn data into decisions and deliver high-speed experiences that drive results.

